Plotly Dashboard to Evaluate Stock Price
By Gunardi Ali |
Description:
This project
![]() aims to help calculating the fair value of a company stock. It calculate if a stock is over- or undervalued, based on its last available annual earning and current interest rate. Without this web app, the author would have to scour the internet to copy the financial datas and entering them manualy into calculator to get an estimation.
aims to help calculating the fair value of a company stock. It calculate if a stock is over- or undervalued, based on its last available annual earning and current interest rate. Without this web app, the author would have to scour the internet to copy the financial datas and entering them manualy into calculator to get an estimation.
Warning: If the app is in sleep mode, it would take 30–45 seconds to reactivate, so have patience.
Details:
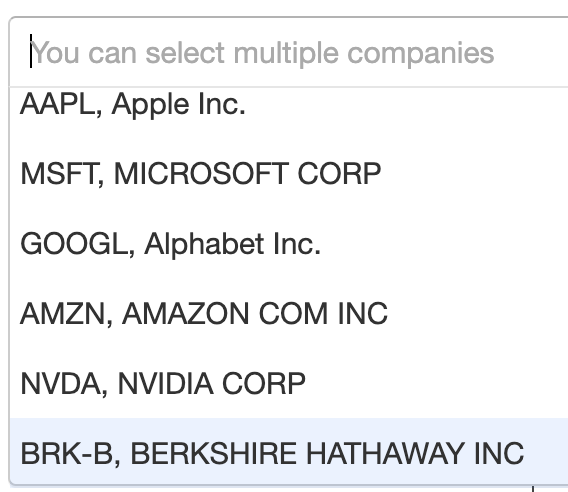
This web app is built with Python and plotly library. After opening the web app
![]() , it performs web scraping to get the up to date list of S&P500 company from Wikipedia. Furthermore it also retrieves list of foreign companies from multiple sources. The complete list of companies is shown as a dropdown menu:
, it performs web scraping to get the up to date list of S&P500 company from Wikipedia. Furthermore it also retrieves list of foreign companies from multiple sources. The complete list of companies is shown as a dropdown menu:
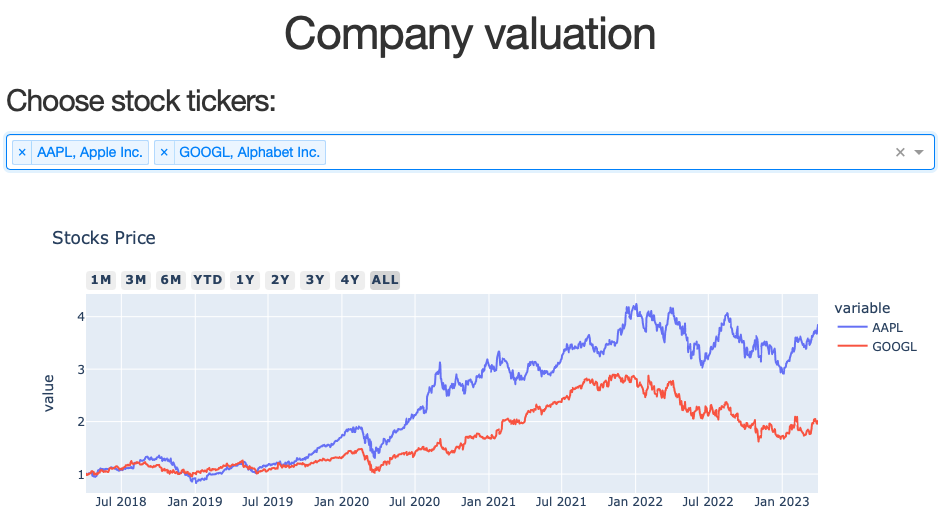
The user can input one or multiple companies either by entering company name Apple or its stock ticker aapl. After selecting companies, the historical stock price is visualized and selected financial metrics are shown in table.
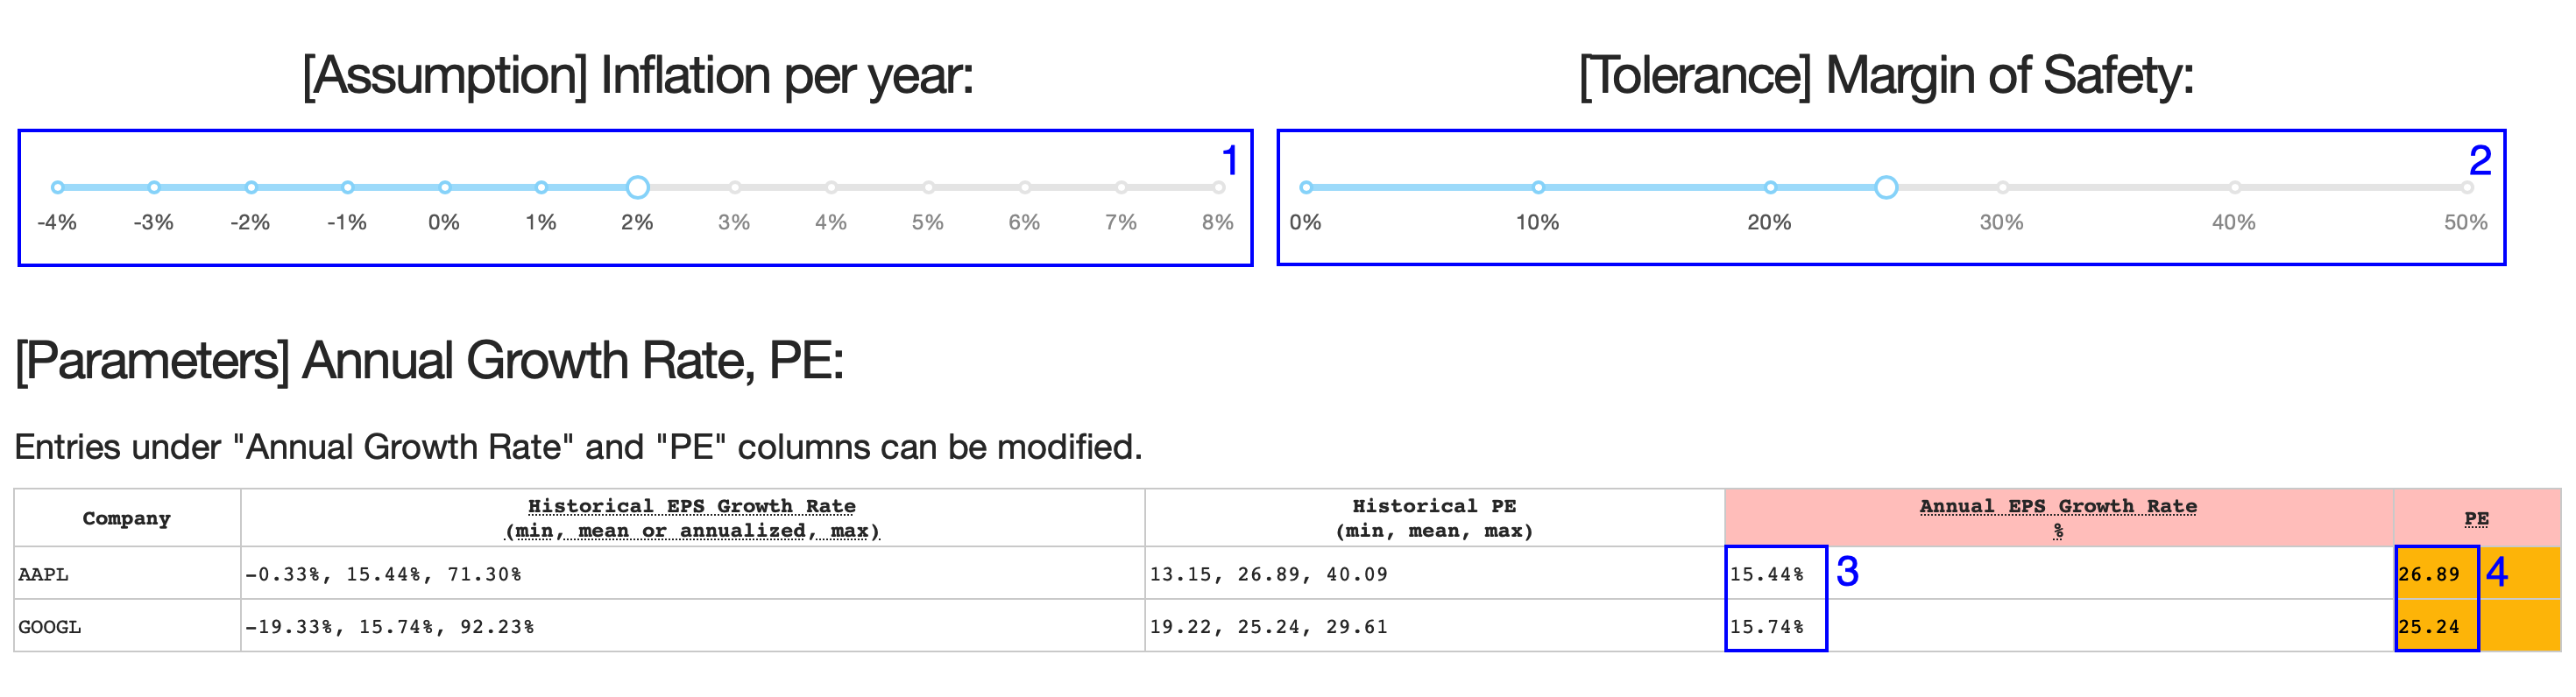
For the fair value calculation, the dashboard needs the following input parameters:
- Assumption: Annual Inflation,
- Tolerance: Margin of Safety,
- Assumption: Annual EPS Growth Rate,
- Assumption: PE-Ratio.
The editable input parameters are shown in the next screenshot: